The data source for this project is drawn from the NYC OpenData portal, specifically the dataset published by the Department of Health and Mental Hygiene. It is a comprehensive collection of civil birth registration records in New York City. The dataset is updated annually from 2011 to 2019. This dataset is updated on an annual basis, covering a span from 2011 to 2019. The data is presented in a structured format, comprising 57,582 rows and 6 columns. The columns are labeled as Year of Birth, Gender, Ethnicity, Child's First Name, Count, and Rank. Year of Birth is the year when the baby is born. Gender is the sex of the baby. The Ethnicity column reflects the child’s mother’s ethnicity, which adds a layer of socio-cultural context to the data. The Count indicates the number of babies given a particular name in a specific year, while Rank represents the popularity of names in descending order for each year.
Upon preliminary inspection, it has been observed that the dataset contains some identical rows within the same year. We plan to combine these identical rows by adding up their counts.
For importing the data into our analysis environment, we have already downloaded the dataset in a CSV file format from the NYC OpenData portal.
This is the data source page: https://data.cityofnewyork.us/Health/Popular-Baby-Names/25th-nujf
2.2 Research plan
What are the most popular names overall and within each ethnic group?
By grouping on the names and aggregate the counts together, it will show the overall popularity of names and we will see which names are most popular across all groups. Then aggregating the counts of names across the years and within ethnic groups, we can identify the popularity of names within each ethnic group, offering insights into cultural preferences and traditions in naming. To visually represent these trends, we plan to use heatmaps to show the frequency of names across different ethnic groups and highlight patterns. other graphs like bar charts to compare the popularity of different names over time and across different ethnic groups.
How does the diversity of names compare between genders?
We first plan to assess the diversity by calculating the number of unique names per gender. We also plan to understand the frequency distribution of names for each gender. A high concentration of babies with a small set of names may indicate lower diversity. We could use chi-square test to determine if the differences in name variaty between genders are statistically significant, not just random. It might also be insightful to examine how the diversity of names has changed over time for each gender. We will use some plots to to see if diversity is increasing, decreasing, or remaining stable.
Is there a trend in the length of names over the years? First, create a new column that represent the length of each name and then calculate the average length of name for each year. Plot the graph and see if there’s an increasing or decreasing pattern in the length of names over the years. Also explore if there are different trends in name length among genders or ethnicity. This can reveal whether naming conventions for boys and girls have evolved differently over time or cultural preferences in name lengths.
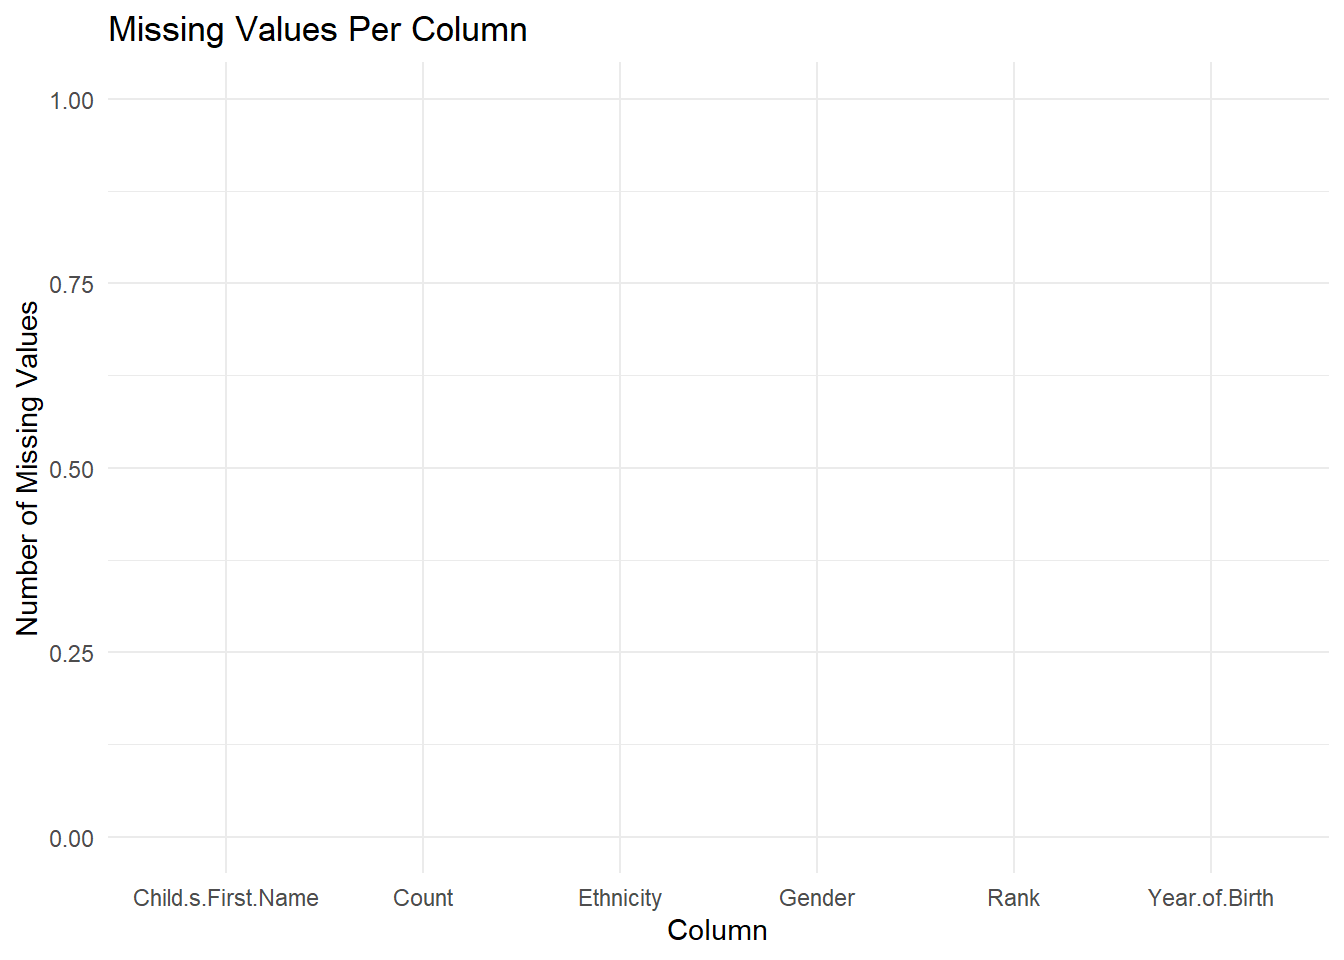
2.3 Missing value analysis
Code
library(ggplot2)
Warning: package 'ggplot2' was built under R version 4.2.3
ggplot(df_missing, aes(x = column, y = missing_count)) +geom_bar(stat ="identity", fill ='steelblue') +ylim(0,max(df_missing$missing_count) +1)+labs(title ="Missing Values Per Column", x ="Column", y ="Number of Missing Values") +theme_minimal()